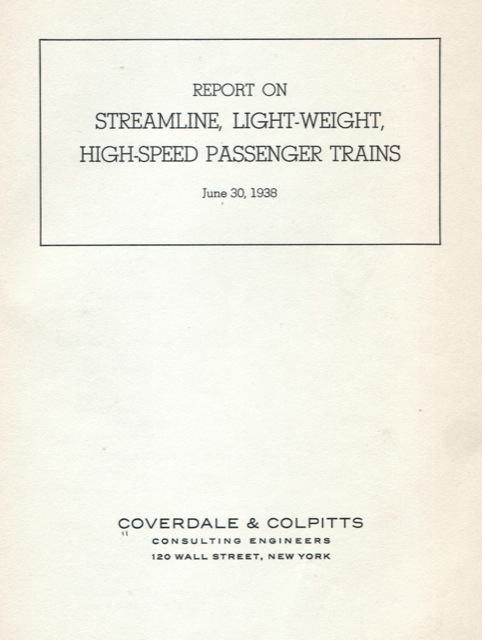
A consulting firm named Coverdale and Colpitts (now part of URS) once did a variety of economic analyses for the rail industry. In 1935, the firm published a report on the Burlington Zephyrs, followed by reports in 1938, 1939, 1941, and 1950 on “Streamline, Light-Weight, High-Speed Passenger Trains.”

Click to download a 6.1-MB PDF of the full 1938 report.
I found out about these reports when I saw the 1939 and 1950 reports for sale on ebay. No one else had bid on them, so I put in a bid . . . only to have someone snipe them away from me. I found the 1938 report on Bookfinder.com and bought it. It has a wealth of fascinating information on all of the trains I’ve discussed so far.
For example, the report reveals that the Denver Zephyr carried well over twice as many passenger miles and earned nearly twice the operating profits as the City of Denver. One reason for this may be fares: fares per mile on the City were twice Zephyr fares. This may have discouraged riders–the City filled only 28 percent of revenue seats while the Zephyr filled 46 percent.
Denver Streamliners
The Denver Zephyr carried far more passenger miles and earned far more operating profits than the City of Denver.
Another problem with the City trains was repairs. The report breaks down expenses into crew, fuel, lubricants (and water if steam powered), supplies, and–depending on the railroad–either repairs or maintenance. The Burlington reported maintenance costs of about 20 cents a train mile, while the Union Pacific reported repair costs of 55 cents a train mile. Is this just a difference in reporting methods? Or does it reflect a higher cost of maintaining the Pullman-built trains vs. the Budd-built trains? Perhaps the Union Pacific had a good reason to keep the M-10003 in reserve as a spare City of Denver.
The report also shows that the Twin Cities Zephyrs, despite their inability to expand in response to changing demand, performed almost as well as the more-flexible Hiawathas. The Zephyrs actually carried slightly more passenger miles than the Hiawathas, but they also had a longer route: the Zephyr’s passenger miles per route mile were about 3 percent less than the Hiawatha’s. The 400s came in a distant third in all relevant categories: gross revenues, net operating revenues, and passenger miles.
Twin Cities Trains
| Train | Hiawatha | Twin Zephyrs | 400 |
|---|---|---|---|
| Gross revenue | 1,337,898 | 1,220,569 | 665,472 |
| Net revenue | 990,934 | 823,442 | 314,821 |
| Route miles | 422 | 441 | 419 |
| Train miles | 308,060 | 641,608 | 324,376 |
| Passenger miles | 64,089,349 | 64,760,743 | 33,273,000 |
| Revenue ¢/PM | 2.1 | 1.9 | 2.0 |
| Net as % of Gross | 74% | 53% | 47% |
| Coach seats | 208 | 160 | 80 |
| First class seats | 76 | 62 | 74 |
| PM/TM | 208 | 101 | 103 |
| Occupancy | 73% | 45% | 67% |
The Hiawathas not only had far more revenue seats than the Twin Zephyrs–284 vs. 222–the Milwaukee filled a much higher percentage of those seats than the Burlington. The Burlington made up the difference by running two trains a day each way, while the Hiawatha only ran once. It is a testament to Diesel’s lower operating costs that the Burlington could run more than twice as many train miles as the Milwaukee for about the same total operating cost.
We can also compare the Chicago-Los Angeles services of the Union Pacific and Santa Fe. The report distinguishes between the first- and second-generation Cities of Los Angeles as well as between the Super Chief and El Capitan. Interpreting the report is complicated by the fact that the first City of Los Angeles train only operated for about nine months and the second for about six months during the period covered by the report, while two Santa Fe Super Chiefs operated for a combined total of 16-1/2 months and two El Capitans operated for a combined nine months.
The numbers show that the Santa Fe filled a much higher share of its revenue seats. But during the months they operated, the Cities of Los Angeles ran at greater frequencies than the Santa Fe trains (every six days vs. every seven days), and combined they carried about 13 percent more passengers and earned 35 percent more profits (due to higher fares per passenger mile) per month than the Santa Fe trains.
Chicago-Los Angeles Streamliners
| Train | Super Chief | El Capitan | City of LA 1 | City of LA 2 |
|---|---|---|---|---|
| Gross revenue | 794,358 | 279,655 | 550,567 | 512,906 |
| Net revenue | 515,337 | 168,385 | 272,846 | 276,233 |
| Route miles | 2,229 | 2,229 | 2,298 | 2,298 |
| Train miles | 316,028 | 164,328 | 235,828 | 145,073 |
| Passenger miles | 26,424,162 | 15,739,789 | 13,744,000 | 13,445,000 |
| Revenue ¢/PM | 3.0 | 1.8 | 4.0 | 3.8 |
| Net as % of Gross | 65% | 60% | 50% | 54% |
| Coach seats | 0 | 156 | 86 | 103 |
| First class seats | 122 | 0 | 102 | 141 |
| PM/TM | 84 | 96 | 58 | 93 |
| Occupancy | 69% | 61% | 31% | 38% |
The report also has data on the Southern Pacific Daylight and Sunbeam, Rock Island Rockets, and several other trains. At the time this report was written, the Denver Zephyr had the greatest operating profits of any streamliner, followed by the Daylight, Hiawatha, City of Denver, and Twin Zephyrs. The report does not reveal the capital costs required to produce these profits, however.
A library 100 miles from my Oregon home is supposed to have a copy of the 1950 report, while for the 1939 and 1941 reports I’ll have to go to the University of Denver. When I manage to scan those reports I’ll present the results here.
